
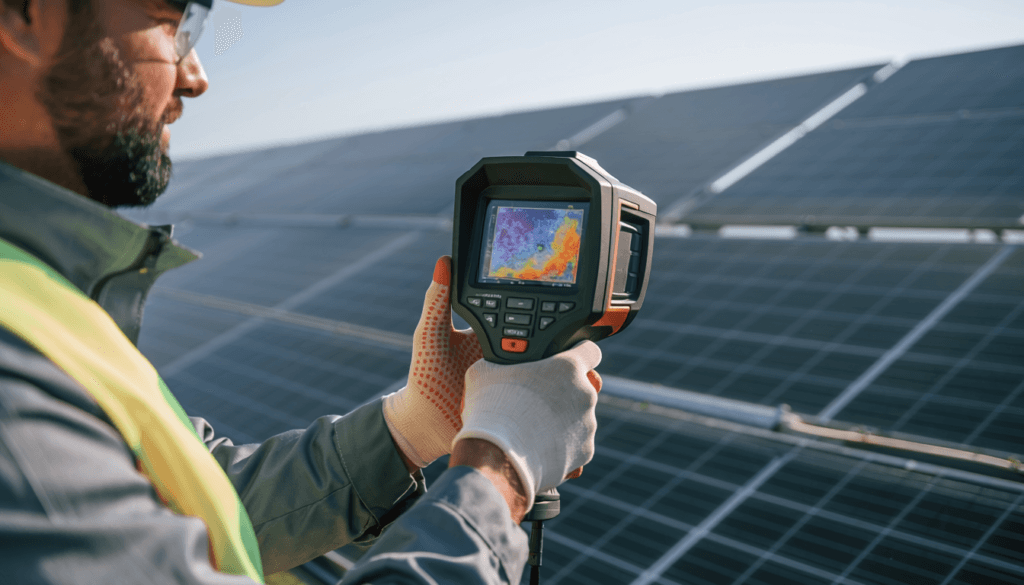
There is a moment in the first year of supervising an industrial solar PV installation when you realize that intuition is not enough.
You walk the site. You look at the panels. Everything seems fine. The monitoring dashboard is green. The monthly production numbers are close to projection — not exactly right, but close enough that no single data point demands attention.
And then, three months later, you run a systematic string measurement and find a deviation that has been building since commissioning. Or you measure the temperature in the inverter room in August and find it has been running at 52°C for weeks without triggering a single alert. Or you compare this month’s PR to six months ago and realize it has been drifting downward so gradually that no individual reading ever looked alarming.
The problem was not that the problems were invisible. It was that nobody was looking in the right place, at the right time, with the right instrument, on a consistent enough schedule to see the trend before it became expensive.
That is what a monthly inspection protocol solves. Not the individual inspection — any experienced engineer can walk a site and notice obvious issues. The protocol. The systematic repetition of the same measurements, in the same sequence, recorded against the same baseline, every month without exception. The comparison that turns a single data point into a trend, and a trend into an early warning.
This article documents the complete monthly field protocol used on an industrial solar installation in Morocco — the measurements, the instruments, the thresholds, the recording format, and the common mistakes that undermine even well-intentioned inspection programs.
Disclosure: This article contains affiliate links. If you purchase through these links, I may earn a small commission at no extra cost to you. I only recommend technical resources that I consider genuinely useful for industrial solar professionals working in Africa and the MENA region.
Why a Monthly Protocol Matters More Than Any Single Inspection
A single inspection tells you the state of the installation today. A monthly protocol tells you whether the installation is getting better or worse — and at what rate.
This distinction is more important than it sounds. The most financially significant performance losses on industrial solar installations — soiling accumulation beyond model assumptions, progressive string degradation, thermal derating in summer — do not announce themselves with sudden, dramatic changes. They accumulate gradually, staying within the noise band of day-to-day variability until enough time has passed that the cumulative loss is measurable.
A monitoring system records this variability continuously — but without a consistent baseline and a structured comparison framework, the signal is buried in the noise. A physical inspection conducted once, without follow-up, finds what is visible today — but cannot distinguish between a normal operating condition and a developing problem that has not yet crossed a visibility threshold.
The monthly protocol addresses both limitations simultaneously. It creates the baseline against which every subsequent measurement is compared. It generates the trend data that makes gradual degradation visible before it compounds into a significant financial loss. And it imposes the discipline of regular, systematic attention on a system that will otherwise drift toward underperformance without ever producing a single dramatic event that demands a response.
The Monthly Field Protocol — Complete Inspection Schedule
The protocol is organized across four weeks of the month — each week with a specific focus, defined instruments, and documented outputs.
Monthly overview — at a glance:
| Week | Focus | Instruments Required | Time Estimate | Output |
|---|---|---|---|---|
| Week 1 | Visual and soiling inspection | Camera, irradiance meter | 2 to 3 hours | Soiling report + anomaly photos |
| Week 2 | String current measurement | DC clamp meter, reference cell | 3 to 4 hours | Current log + flagged strings |
| Week 3 | Thermal and electrical inspection | Thermometer, IR camera | 2 to 3 hours | Thermal report + MC4 inspection |
| Week 4 | Performance review and documentation | Monitoring data, monthly log | 1 to 2 hours | Monthly PR report + complete log |
Total monthly time estimate: 8 to 12 hours for a 2 MWp installation.
This table is designed to be used as a planning reference — printed, posted in the site office, and reviewed at the start of each week to confirm that instruments are available and the inspection window is scheduled.
Week 1 — Visual and Soiling Inspection
Objective: Assess panel surface condition, identify visible damage, and evaluate soiling accumulation relative to the cleaning schedule.
What to inspect:
Walk the full array systematically — row by row, not selectively. Visual inspection should cover:
- Panel surface soiling — note areas of heavier accumulation near access roads, industrial exhaust points, or prevailing wind directions
- Visible physical damage — cracks, delamination, discoloration, bird droppings concentrated on specific panels
- Mounting structure integrity — loose fasteners, signs of corrosion, frame deformation
- Cable management — exposed DC cables, damaged conduits, MC4 connectors exposed to mechanical stress
- Drainage and water management — standing water near foundations, blocked drainage channels
Instruments required:
- Camera or smartphone — document every anomaly with a dated photograph
- Irradiance meter or reference cell — measure plane-of-array irradiance at the time of inspection for baseline comparison
What to record:
A brief written note and photograph for every anomaly identified. A soiling rating for the array — clean, light soiling, moderate soiling, heavy soiling — correlated with the number of days since the last cleaning cycle. If soiling is rated moderate or heavy within seven days of the last cleaning, the cleaning frequency is insufficient for the site’s actual soiling behavior and should be increased.
The threshold that triggers action:
If PR data from the monitoring system shows a decline of more than 3% compared to the post-cleaning baseline, and the visual inspection confirms moderate or heavy soiling, the cleaning interval needs to be shortened — not the cleaning quality improved. The soiling rate is a site characteristic, not a controllable variable.
Week 2 — String Current Measurement
Objective: Identify strings underperforming relative to their corrected expected output — losses that monitoring systems do not detect.
What to measure:
At the combiner box level, measure the DC current of every string individually using a calibrated clamp meter. The measurement takes 30 to 60 seconds per string. For a 2 MWp installation with approximately 172 strings, the complete measurement cycle takes three to four hours under stable irradiance conditions.
Instruments required:
- Calibrated DC clamp meter — a Fluke 376 FC or equivalent, rated for accurate measurement in the 10 to 18 ampere range typical of 580 Wp monocrystalline strings
- Calibrated reference cell or irradiance meter — placed at the same tilt and orientation as the array, providing real-time plane-of-array irradiance for baseline correction
- Measurement log — a simple spreadsheet recording string ID, measured current, expected current at measured irradiance, and deviation percentage
How to calculate the expected current:
Using the panel’s STC short-circuit current specification, corrected for measured irradiance and ambient temperature, calculate the expected current for each string under current conditions. Any measured value more than 5% below this corrected expected value warrants investigation. Any deviation above 10% requires immediate follow-up. Any deviation above 15% is a priority corrective action.
What to record:
Every string measurement with its corrected deviation — positive or negative. Strings flagged for follow-up. Any strings whose deviation has increased compared to the previous month’s measurement.
The threshold that triggers action:
A single string deviating more than 10% from expected output should be scheduled for thermal imaging within the same week. A string deviating more than 15% should be treated as a priority fault — the financial cost of a 15% string loss compounding monthly is significant enough to justify immediate investigation even if monitoring shows no alert.
Week 3 — Thermal and Electrical Inspection
Objective: Assess inverter room thermal conditions, identify connection degradation, and perform targeted thermal imaging on flagged strings.
Inverter room temperature assessment:
Measure and record the ambient temperature inside the inverter room at three points in the day — morning before peak irradiance, midday peak, and early afternoon. Record outdoor ambient temperature simultaneously for comparison.
If the midday inverter room temperature exceeds 45°C, thermal derating is occurring or imminent. If it exceeds 50°C, derating is active during peak production hours and the ventilation system requires immediate assessment. If it exceeds 55°C, the financial impact of derating is significant and a ventilation upgrade should be treated as a priority capital improvement, not a deferred maintenance item.
Ventilation system check:
Verify that mechanical ventilation is functioning — fans operating, airflow unobstructed, air intake filters clean. A ventilation system that is installed but not maintained provides progressively less thermal protection as filters accumulate dust.
Thermal imaging of flagged strings:
For every string flagged during Week 2 with a deviation above 10%, conduct a thermal imaging inspection of the panels in that string. Perform this between 10 AM and 2 PM under stable, high-irradiance conditions — the thermal contrast between healthy and degraded cells is maximized under these conditions.
Document every hot spot identified — panel location, thermal contrast against neighboring panels, pattern of the anomaly (full cell, bypass diode zone, cell cluster). This documentation is the input to the corrective action decision: whether the anomaly is a monitoring priority, a cleaning issue, a connection problem, or a panel replacement case.
MC4 connector spot inspection:
Visually inspect a sample of accessible MC4 connectors — focusing on areas of mechanical stress, UV exposure, and thermal cycling. Any connector showing visible degradation — discoloration, deformation, loss of retention — should be replaced rather than monitored.
Instruments required:
- Thermometer or data logger — for inverter room temperature measurement
- IR camera — for thermal imaging of flagged strings and connections
- Flashlight — for inspection of junction boxes and conduit entry points
Week 4 — Performance Review and Documentation
Objective: Calculate the monthly Performance Ratio, compare against previous months and the annual baseline, review monitoring alerts, and document the complete inspection cycle.
Monthly PR calculation:
Using monitoring system data for the full month, calculate the actual PR — total energy produced divided by total irradiation times installed capacity. Compare this figure to:
- The previous month’s PR — to identify month-on-month trends
- The same month last year — to account for seasonal irradiance variation
- The commissioning baseline PR — to quantify total performance drift since installation
A PR decline of more than 2 percentage points compared to the same period last year, without a clear explanation (extended low-irradiance weather, planned maintenance outage), is a signal that requires investigation beyond what any single week’s inspection can explain.
Monitoring alert review:
Review all monitoring alerts generated during the month — inverter faults, communication errors, production anomalies. For each alert, confirm that a corrective action was taken and documented. Unresolved alerts from previous months should be escalated.
Inspection documentation:
Compile the week’s findings into the monthly inspection log. This log should contain, at minimum:
- PR for the month versus baseline and previous months
- Soiling rating at the time of Week 1 inspection and cleaning frequency assessment
- String current measurement summary — number of strings measured, number flagged, deviation ranges, corrective actions initiated
- Inverter room temperature — peak recorded, ventilation status
- Thermal imaging findings — panels inspected, hot spots identified, actions recommended
- Any open corrective actions from previous months and their current status
The Measurements That Matter Most — And the Thresholds That Should Trigger Action
| Measurement | Normal Range | Alert Threshold | Recommended Action |
|---|---|---|---|
| Monthly PR | 77% to 84% | Below 75% | Immediate comprehensive inspection |
| String current deviation | Less than 5% | Above 10% | Thermal imaging within one week |
| String current deviation — severe | Less than 5% | Above 15% | Priority corrective action — same week |
| Inverter room temperature — midday | Below 45°C | Above 50°C | Ventilation assessment |
| Inverter room temperature — critical | Below 45°C | Above 55°C | Priority ventilation upgrade |
| PR month-on-month decline | Less than 1% | Above 2% | Root cause investigation |
| Days since last cleaning | 7 to 10 days | Above 10 days | Clean immediately |
| Soiling rating at day 7 post-cleaning | Light | Moderate or heavy | Increase cleaning frequency |
These thresholds are calibrated to the operating environment of a heavy industrial site in Morocco — high irradiance, significant soiling, summer temperatures that routinely trigger inverter thermal derating. For installations in different environments, the thresholds require recalibration against site-specific baseline data.
The Minimum Dataset for a Well-Supervised Installation
After twelve months of consistent monthly inspection, the following dataset should exist for any well-supervised industrial solar installation:
- Twelve monthly PR values with weather and maintenance context
- A complete string current baseline — every string measured under comparable conditions at least four times per year
- A thermal imaging record — every hot spot identified, dated, and tracked to resolution
- Twelve months of inverter room temperature data — daily peak values, not just monthly averages
- A cleaning log — date, method, pre- and post-cleaning PR comparison
- An open corrective actions register — every identified issue tracked from identification to resolution
A well-structured monthly log entry looks like this:
Month: June 2026 — Industrial Solar Installation — Morocco
Monthly PR: 79.3% (vs 81.2% in May 2026 | vs 80.1% in June 2025 | vs 84% commissioning baseline)
Soiling rating at Day 8 post-cleaning: Moderate — cleaning interval reduced from 10 to 7 days
Strings measured: 172 | Flagged above 5%: 4 | Flagged above 10%: 1 | Above 15%: 0
String 47 — deviation 11.3% — thermal imaging scheduled Week 3
Inverter room peak temperature: 53°C (June 15) — ventilation filter cleaned, fan speed increased
Open corrective actions: String 47 thermal imaging (due Week 3) | MC4 connector replacement row 12 (due July)
Next month focus: String 47 follow-up | Pre-summer ventilation check
This is not a complex document. It is a disciplined one — and the discipline of producing it every month, without exception, is what makes twelve months of data more valuable than any individual inspection report.
This dataset is what separates a supervised installation from a monitored one. It is also what makes a performance audit meaningful — because it provides the comparative baseline that reveals whether the installation is performing at its potential or drifting below it.
For engineers and O&M managers who want to build a rigorous, comprehensive framework for industrial solar supervision — covering degradation mechanisms, performance measurement methodologies, and long-term asset management — Photovoltaic Systems Engineering by Messenger and Abtahi provides the technical foundation needed to design and implement an inspection program that goes beyond checklists to a genuinely analytical supervision approach.
The Common Mistakes That Undermine Even Good Inspection Programs
A checklist without a baseline is a list of observations. An observation without a comparison is a data point. A data point without a trend is almost meaningless.
The most common mistakes in industrial solar inspection programs are not technical. They are organizational:
Measuring without a baseline
String current measurements taken without a corrected expected value to compare against produce numbers, not insights. Every measurement needs a reference point to be interpretable.
Inspecting without recording
A verbal report of what was found during an inspection is not a supervision record. If it is not written down with a date, an instrument reading, and a photograph, it did not happen for the purposes of trend analysis.
Recording without comparing
Monthly logs that are filed but not reviewed against previous months miss the entire purpose of systematic inspection. The value of the data is in the comparison, not the collection.
Comparing without acting
An inspection program that identifies deviations but does not generate corrective actions within a defined timeframe is a documentation exercise, not a supervision program. Every flagged item should have an assigned owner, a defined resolution path, and a tracked status.
A concrete example of how these mistakes compound: an installation where string current measurements were taken correctly every month — but recorded in a notebook that was never transferred to a spreadsheet. After eight months, a string showing a consistent 8% deviation was finally flagged — but because there was no digital record, it was impossible to determine whether the deviation had been present since commissioning or had developed progressively. The difference matters: a deviation present since commissioning suggests a manufacturing or installation issue; a progressive deviation suggests degradation or connection resistance increase. Without the trend data, the corrective action is a guess. With it, it is a diagnosis.
Treating monitoring alerts as the complete picture
As documented across multiple articles on this blog — from the SEPAM relay that tripped without explanation to the string that lost 15% of its output without generating a single flag — monitoring systems record what meters measure. They do not explain why. Physical inspection is what bridges that gap.
Twenty articles on this blog have documented the same fundamental truth from different angles.
The inverter room that reached 52°C without triggering an alarm. The SEPAM relay that tripped 2 to 4 times a day from a parameter that no monitoring report flagged. The string that lost 15% of its output while every dashboard showed green. The feasibility study that projected 85% PR on a site that delivered 77%. The 2,250,000 USD in silent losses that accumulated across 25 years without a single corrective work order being generated.
Every one of these cases has the same root cause: the gap between what a system records and what a supervisor actually knows. Monitoring records. Supervision understands. The difference between those two verbs is the difference between an installation that performs and one that drifts.
The monthly protocol in this article is not a complex engineering solution. It is a discipline — a systematic commitment to looking at the right things, measuring them with calibrated instruments, recording the results, comparing them against a baseline, and acting when the comparison reveals a deviation that costs money.
For any organization evaluating a solar PV asset in MENA or Africa — whether as an investor, a lender, or a technical partner — the existence of a documented monthly inspection protocol like this one is one of the clearest signals that an installation is actually supervised rather than simply monitored. The dataset it generates over 12 months is more informative than any monitoring dashboard report, and more defensible than any feasibility study projection. It is what real operational performance looks like, documented month by month, with calibrated instruments and honest recording.
On an industrial solar PV installation in Morocco, this discipline is the difference between a Performance Ratio that drifts toward 77% and one that holds toward 84%. Over 25 years, that difference is worth more than the cost of every inspection ever conducted.
The dashboard will never tell you to pick up a clamp meter and walk the combiner boxes. That decision belongs to the supervisor — which is exactly why supervision matters.
Looking for verified data?
The field insights behind this article are fully documented in the MENA Industrial Solar Data Guide. Get access to real project costs, actual KPIs, and genuine O&M benchmarks from a live industrial installation in the MENA region.
👉📘 75 pages of pure field data. Zero simulations.
👉 Get the Guide — $29 USD
Get the Free Preview
The first 8 pages of the MENA Industrial Solar Data Guide — real Performance Ratio data, soiling measurements, and thermal derating figures from an industrial installation— No spam, just real data.
Disclosure: This article contains affiliate links. If you purchase through these links, I may earn a small commission at no extra cost to you. I only recommend technical resources that I consider genuinely useful for industrial solar professionals working in Africa and the MENA region.
Publié par :
Solar PV MENA Expert