
Published on: Aug 08, 2026.
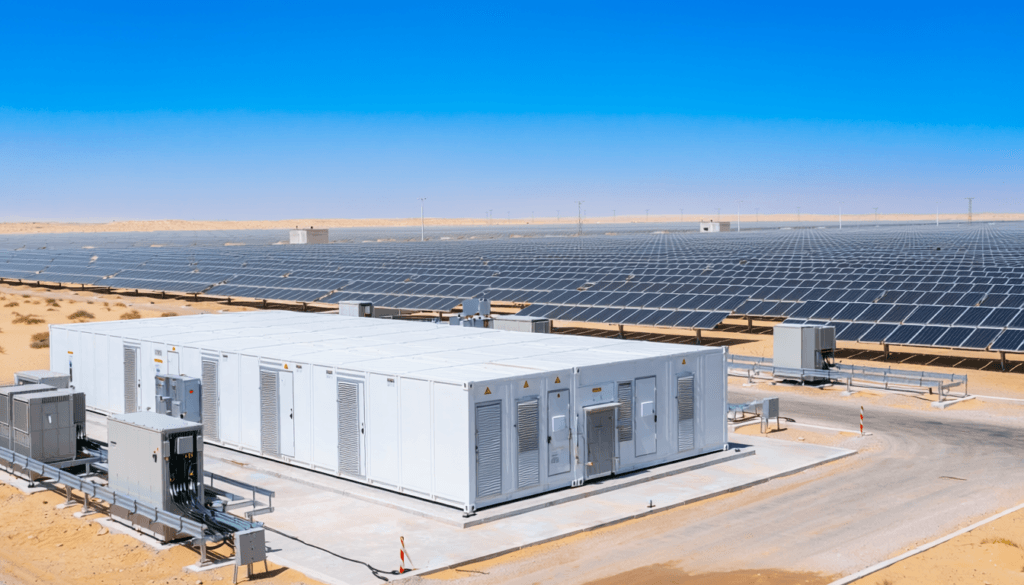
Two projects. One country. One month. A new benchmark for solar energy in Africa.
In the summer of 2026, the Obelisk project in Egypt inaugurated its first phase in Qena — 500 MW of solar generation capacity combined with 200 MWh of battery energy storage, developed by Scatec and described as the largest renewable energy project on the African continent. Simultaneously, the Abydos II project in Aswan — 1,000 MW of solar PV paired with 600 MWh of battery storage, a 700 million USD investment jointly developed by AMEA Power and Kyuden International — reached commercial operation, setting a new benchmark for utility-scale renewable energy and energy storage on the continent.
In a matter of weeks, Egypt moved from a significant emerging solar market to the undisputed leader in African utility-scale solar deployment.
The megawatts are impressive. The financing is substantial. The irradiation advantage is real — Egypt’s solar resource, particularly in Upper Egypt where both projects are located, is among the strongest on the planet, with annual irradiation of 2,000 to 2,400 kWh per square meter.
But the conversation that is not happening — in any of the coverage of these inaugurations — is what comes next for the thousands of commercial and industrial installations that will follow in the wake of these benchmark projects. The C&I operators in Egyptian industrial zones, manufacturing facilities, and processing plants who are looking at these projects and deciding that solar is now the obvious choice for their own energy costs.
This article is that conversation.
Disclosure: This article contains affiliate links. If you purchase through these links, I may earn a small commission at no extra cost to you. I only recommend technical resources that I consider genuinely useful for industrial solar professionals working in Africa and the MENA region.
What Egypt Just Built — The Numbers That Matter
The scale of what Egypt has commissioned in 2026 deserves to be understood precisely, because it frames the C&I opportunity that follows.
The first phase of the Obelisk solar project in Qena — described as the largest renewable energy project in Africa — delivered 500 MW of solar generation capacity alongside 200 MWh of battery energy storage. Developed and constructed by Scatec, it is expected to reach 1 GW of total solar capacity once the second phase is completed, generating approximately 2.2 TWh of electricity annually.
The Abydos II project — 1,000 MW solar PV and 600 MWh battery facility in Egypt’s Aswan Governorate, jointly owned by AMEA Power and Kyuden International Corporation — represents a 700 million USD investment expected to deliver over 3 million MWh of clean electricity annually, powering more than 500,000 Egyptian households and offsetting 1.6 million tonnes of CO₂ emissions each year.
The broader context makes these numbers even more significant. Analysis by DNV shows that renewable generation capacity in MENA is set to grow around tenfold by 2040 — with solar and wind together projected to generate approximately 85% of electricity in the region by 2060.
Egypt is not a passive participant in this transformation. It is leading it — with an irradiation advantage that makes its solar economics among the most compelling anywhere in the world, and a C&I market that is now watching these benchmark projects and drawing conclusions about what solar can do for industrial energy costs.
Why Egypt Is Operationally Different — And Why That Matters for C&I Operators
Egypt is not Morocco. It is not Saudi Arabia. It shares the high-irradiation desert environment of the broader MENA region — but it has specific operational characteristics that make the direct application of performance assumptions from other markets a significant risk.
Here is how the operating environments compare directly:
| Operational Factor | Morocco — Real Field Data | Egypt — Conservative Estimate |
|---|---|---|
| Annual soiling — industrial site | 5% to 8% | 6% to 10% — Nile Delta more complex |
| Inverter room temperature — summer | 50°C to 55°C | 55°C to 65°C — Upper Egypt more extreme |
| Thermal derating observed | 6% to 12% | 8% to 15% — proportionally more severe |
| Dominant soiling type | Cement dust and desert particulate | Fine particles + urban pollution + coastal humidity |
| Coastal humidity impact | Low — dry environment | Moderate to high — northern coast |
| Performance Ratio observed | 77% to 84% | To be validated — likely comparable or lower |
This table is not a theoretical comparison. The Morocco column is measured field data. The Egypt column is a conservative, evidence-based projection from a more operationally demanding version of the same high-irradiance environment.
The Nile Delta industrial environment
The majority of Egypt’s commercial and industrial activity is concentrated in the Nile Delta and along the Cairo-Alexandria corridor — an environment characterized by a combination of fine desert dust, agricultural particulate matter, industrial emissions from manufacturing zones, and vehicle traffic from one of the most densely populated urban corridors in Africa.
This is a very different soiling environment from the clean desert sand of Saudi Arabia’s southern provinces or the industrial cement dust of Morocco’s heavy industry sites. It is in many ways more challenging — because the combination of fine particulates from multiple sources creates a soiling layer that accumulates faster and adheres more strongly than either pure desert sand or single-source industrial contamination.
A soiling assumption of 3% to 5% annually — the standard regional benchmark applied in most Egyptian C&I solar feasibility studies — is almost certainly optimistic for installations in the Nile Delta industrial corridor. Measured soiling rates on comparable industrial sites in high-particulate environments consistently run 5% to 8% or higher. On a typical C&I industrial installation generating approximately 180,000 USD per year per MWp in energy savings, the difference between a 3% soiling assumption and a 7% operational reality is 12,600 USD per year per MWp — a gap that over 25 years represents 315,000 USD per MWp in unbudgeted losses from a single assumption that was never validated against the specific dust environment of this industrial site.
The thermal profile — extreme and prolonged
Cairo regularly exceeds 40°C during summer months. Upper Egypt — where both the Obelisk and Abydos II projects are located, and where future large-scale industrial developments will increasingly be sited — routinely reaches 45°C to 50°C ambient temperature from June through September.
Inverter room temperatures in facilities located in these environments will reach 55°C to 65°C during peak summer hours — well above the 45°C derating threshold of most string and central inverters. The thermal derating that this triggers — 8% to 15% output loss during the hours of highest irradiance — is a predictable, measurable, and largely preventable performance loss that will be absent from the energy yield models of most Egyptian C&I feasibility studies. On a typical C&I installation in Upper Egypt, this translates to approximately 10,000 to 15,000 USD per year per MWp in avoidable production losses during peak summer months — a figure that scales directly with installation size and compounds across the full project lifetime.
The coastal humidity factor — northern installations
For C&I installations in Alexandria, Port Said, and the northern coastal industrial zones — a significant share of Egypt’s manufacturing base — the operating environment adds a dimension that pure desert sites do not face: humidity cycling. Day-night and seasonal humidity variations in coastal areas accelerate the corrosion of electrical connections, the degradation of MC4 connectors, and the growth of biological films on panel surfaces that behave differently from mineral dust soiling and are harder to remove with standard cleaning protocols.
In practical O&M terms, coastal Egyptian installations require three adaptations that inland desert installations do not: stainless steel or marine-grade hardware for mounting and electrical components, a cleaning protocol that addresses biological film accumulation — which does not respond to the same cleaning methods as mineral dust — and a more frequent MC4 connector inspection schedule, since humidity cycling accelerates oxidation at connection points significantly faster than in purely arid environments.
The grid constraint reality
Egypt’s electricity grid — particularly in industrial zones — has significant constraints that affect the practical design of C&I solar installations. Grid quality issues, including voltage fluctuations and harmonic distortion from industrial loads, create a more demanding operating environment for inverters than the clean grid connections assumed in most yield models. The interaction between local grid quality and inverter performance is a design factor that should be explicitly addressed in any C&I solar engineering study — and is rarely included in standard feasibility documentation.
The Three Operational Gaps That Will Repeat in Egypt
The pattern documented across industrial solar installations in Morocco, Saudi Arabia, and Africa’s broader C&I market will repeat in Egypt — because the underlying causes are not country-specific. They are generic to how feasibility studies are produced and how industrial solar installations are supervised.
Gap 1 — Soiling modeled at regional averages, not site-specific measurement
Every Egyptian C&I solar feasibility study produced in the next five years will use a soiling loss assumption derived from a regional database or a previous project. Almost none of them will include a site-specific dust deposition measurement conducted at the actual installation location over a meaningful observation period.
The financial consequence is the same as it has been across MENA: an annual performance shortfall that begins on day one of operation, compounds silently across the project lifetime, and never appears as a distinct line item in any financial report. On a typical industrial installation in the Nile Delta, this gap represents 12,600 USD per year per MWp — with 315,000 USD per MWp accumulating silently over 25 years from a single assumption that was never validated.
Gap 2 — Inverter thermal derating not modeled for Egyptian summer conditions
The inverter rooms on C&I solar installations commissioned in Cairo, Aswan, or Upper Egypt over the next three years will reach 55°C to 65°C during peak summer months. The energy yield models that justified those investments will not include this loss — because inverter thermal derating is absent from standard MENA feasibility models, as documented across multiple analyses on this blog.
In Upper Egypt, where ambient temperatures are more extreme than in Morocco’s industrial sites, the annual derating loss per MWp is likely higher than what has been documented in Morocco — making the case for thermal management even more financially compelling.
Gap 3 — Monitoring systems that will miss the most expensive losses
The C&I solar installations being commissioned in Egypt in 2026 and 2027 are being equipped with monitoring systems — this is progress. But monitoring records production without explaining performance. The string losses that will develop silently over the first two to three years of operation — connection resistance degradation, micro-crack propagation, partial shading from unplanned obstructions — will not be detected by any monitoring dashboard.
On installations across the MENA region, string losses exceeding 15% of expected output have been identified through physical inspection — losses that generated no monitoring alerts and were invisible in production data until a systematic on-site measurement program found them. There is no technical reason this pattern will not repeat on Egyptian C&I installations operating under the same monitoring paradigm.
What Egyptian C&I Operators Can Do Differently From Day One
Three actions would materially change the operational outcome of C&I solar installations being developed in Egypt right now — each with a return on investment that makes the business case straightforward:
Action 1 — Require a site-specific soiling measurement before finalizing the energy yield model
A 30-day dust deposition study at the actual installation location costs approximately 2,000 to 5,000 USD. Against 12,600 USD per year per MWp in annual losses that the study prevents — payback in less than six months. Every feasibility study for a C&I installation in Egypt should include this measurement. Almost none currently do.
Action 2 — Design the inverter room for Egyptian summer conditions, not datasheet ratings
The maximum ambient temperature in the inverter room in August should be measured — or estimated conservatively based on local climate data and building thermal modeling — before inverter specifications are finalized. A mechanical ventilation system sized for the actual thermal load of the location costs between 800 and 2,500 USD installed. Against 10,000 to 15,000 USD per year per MWp in recovered production during summer derating events — payback in under three months in most Upper Egyptian locations.
Action 3 — Specify a physical inspection program in the O&M contract before commissioning
The O&M contract for any C&I solar installation in Egypt should include — from day one — a biannual string current measurement program, annual thermal imaging of the array, and quarterly inverter room temperature logging. Cost: approximately 3,000 to 8,000 USD per year per MWp. Against string losses that compound silently without detection — payback within the first corrective action triggered by the inspection program.
For Egyptian engineers, developers, and asset managers who want to build the analytical framework needed to evaluate C&I solar projects with genuine rigor — understanding yield modeling, feasibility study review, and O&M planning in high-irradiance, high-temperature environments — Solar Energy Engineering: Processes and Systems by Soteris Kalogirou provides one of the most comprehensive analytical foundations available, covering degradation mechanisms, soiling behavior, and system-level performance modeling with the depth needed to interrogate feasibility assumptions rather than simply accept them.
Egypt has earned its position as Africa’s solar benchmark. The Obelisk and Abydos II projects are genuine achievements — technically ambitious, financially significant, and strategically important for the energy transition of the continent’s most populous country.
What comes next — the thousands of C&I installations that will follow in the commercial and industrial zones of Cairo, Alexandria, Aswan, and the Nile Delta — will determine whether Egypt’s solar ambition delivers its promised financial returns or follows the pattern documented across the MENA region: strong project announcements, optimistic feasibility projections, and quiet, compounding underperformance that begins on day one of operation and continues for 25 years.
On a typical C&I industrial installation in Egypt — combining a soiling gap of 12,600 USD per year per MWp, thermal derating losses of 10,000 to 15,000 USD per year per MWp, and undetected string losses comparable to those documented across MENA installations — the total preventable annual loss per MWp reaches approximately 25,000 to 35,000 USD. Over a 25-year project lifetime, that compounds to 625,000 to 875,000 USD per MWp in losses that were predictable from day one, preventable with standard supervision discipline, and entirely absent from the financial model that justified the investment.
Egypt has the benchmark projects. The question is whether the C&I installations that follow will be built and operated to match them — or whether they will repeat the same operational gaps that have been quietly costing money across the MENA region for years.
Morocco’s industrial solar installations learned some of these lessons on the ground. Egypt has the opportunity to learn them in advance — if the developers, engineers, and investors commissioning C&I solar projects in 2026 and 2027 choose to ask the right questions before the first panel is installed.
That choice costs nothing. The alternative costs significantly more.
Looking for verified data?
The field insights behind this article are fully documented in the MENA Industrial Solar Data Guide. Get access to real project costs, actual KPIs, and genuine O&M benchmarks from a live industrial installation in the MENA region.
👉📘 75 pages of pure field data. Zero simulations.
👉 Get the Guide — $29 USD
Get the Free Preview
The first 8 pages of the MENA Industrial Solar Data Guide — real Performance Ratio data, soiling measurements, and thermal derating figures from an industrial installation— No spam, just real data.
Disclosure: This article contains affiliate links. If you purchase through these links, I may earn a small commission at no extra cost to you. I only recommend technical resources that I consider genuinely useful for industrial solar professionals working in Africa and the MENA region.
Publié par :
Solar PV MENA Expert