
Published on: Sep 12, 2026.
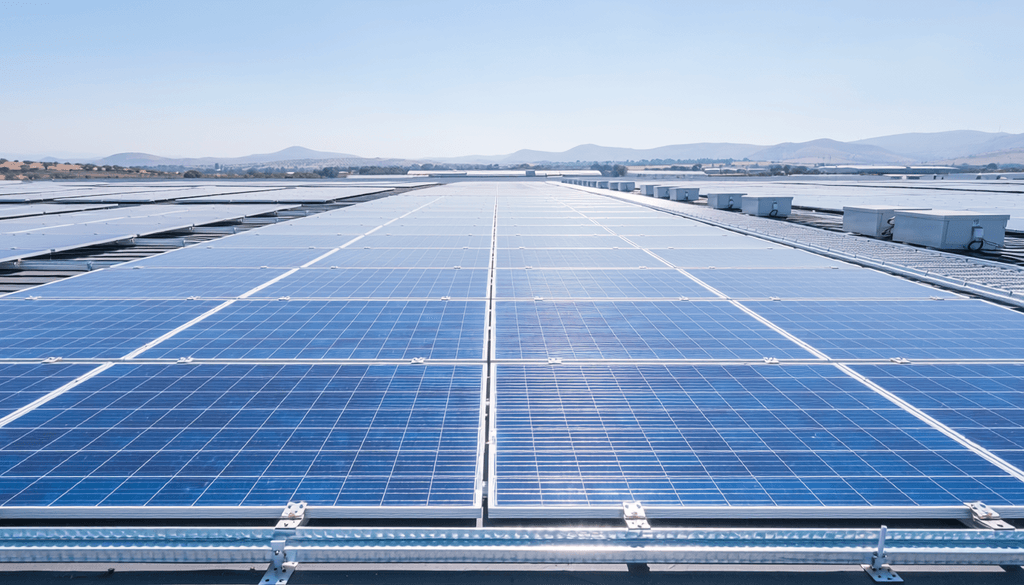
The numbers that define a market transformation are usually announced gradually — a gigawatt here, a procurement round there, a record tariff celebrated at a ribbon-cutting ceremony.
South Africa’s solar transformation did not unfold gradually. It accelerated.
In March 2022, South Africa had 983 MW of rooftop solar capacity. By July 2026, that figure had exceeded 8.3 GW — a growth of more than 8x in four years, driven not by government programs but by private businesses and industrial operators who could no longer afford to wait for grid reliability that was not coming.
Total installed solar PV capacity in South Africa now exceeds 10.2 GW — firmly establishing the country as the continental leader for installed capacity and securing its position among the top 20 solar PV markets globally. The South African solar energy market, valued at 9.76 GW in 2026, is projected to reach 16.88 GW by 2031 at a compound annual growth rate of 11.58%.
This is not a market that is building toward transformation. It is a market that has already transformed — faster, more organically, and more driven by industrial and commercial necessity than almost any comparable solar market in the world.
But here is what the growth figures do not show.
A market that installs 8 GW of rooftop solar in four years — largely in response to an acute energy crisis — installs fast. And installations that happen fast, under pressure, with minimal regulatory oversight and acute cost sensitivity, carry a specific set of operational risks that the next generation of C&I operators needs to understand before they commission their own installations.
South Africa’s solar market has moved beyond the reactive crisis-mode installations of previous years toward sophisticated, market-led growth. The operational challenge now is whether the discipline of that sophistication extends all the way to the site — to the commissioning process, the O&M protocol, and the performance measurement framework that will determine whether these installations deliver what their financial models promised over the next 20 to 25 years.
Disclosure: This article contains affiliate links. If you purchase through these links, I may earn a small commission at no extra cost to you. I only recommend technical resources that I consider genuinely useful for industrial solar professionals working in Africa and the MENA region.
What South Africa Just Built — The Numbers That Define a Continental Leader
The scale of South Africa’s solar transformation deserves to be understood in its full context, because it frames both the opportunity and the operational responsibility that follows.
By July 2026, installed rooftop solar capacity in South Africa had exceeded 8.3 GW, and formal market mechanisms are expanding around grid export and aggregation. Installed capacity now exceeds 10.2 GW, firmly establishing South Africa as the continental leader and securing its place among the top 20 solar PV markets globally.
The April 2026 launch of the South African Wholesale Electricity Market — SAWEM — represents a structural shift in how solar energy is valued and traded. By transitioning to an open multi-player electricity market, SAWEM creates both new revenue opportunities for C&I solar operators and new performance requirements: in a competitive wholesale market, the gap between projected and actual solar output has direct financial consequences that do not exist in a simple autoconsumption model.
To make this concrete: a C&I operator who commits to delivering 1,000 MWh per month to a SAWEM offtaker — based on a solar yield model that assumes 3% annual soiling loss on a Northern Cape mining site where actual soiling runs at 7% — will consistently deliver 40 MWh less than committed per month. At a SAWEM spot price of 0.08 to 0.12 USD per kWh, this monthly shortfall represents a revenue gap of 3,200 to 4,800 USD — plus any contractual penalty for non-delivery. Over 12 months, that is 38,400 to 57,600 USD in underdelivery consequences from a single assumption that was never validated on site.
In June 2026, Volkswagen Group Africa completed a 0.88 MW solar PV installation at its components plant in Kariega, Eastern Cape, comprising 1,410 panels — highlighting ongoing C&I adoption where rooftops and adjacent facilities are used to reduce grid dependence and stabilize operating costs.
This is the defining characteristic of South Africa’s solar growth: it is industrial and commercial operators — manufacturers, mining companies, logistics facilities, food processors — who have driven the rooftop solar surge, not residential consumers. Their motivation is operational and financial: energy cost reduction, production continuity during outages, and increasingly, the ability to participate in a liberalizing electricity market through PPA structures that require dispatchable generation.
Photovoltaic assets represented 92.62% of installed capacity in 2025, maintaining an 8.2% compound annual growth rate from 2019 to 2024.
Why South Africa’s Operating Environment Is Operationally Distinct
South Africa is not MENA. The comparison is instructive precisely because of where the operating environments converge and where they diverge — and because the operational risks that matter most in South Africa are not always the same as those that dominate in Morocco, Egypt, or Saudi Arabia.
The Northern Cape — where irradiance meets mining
The Northern Cape is pivotal for new projects — bifacial modules paired with single-axis trackers increase capacity factors to the 28 to 32% range in this region. Average solar irradiation across South Africa ranges between 4.5 and 6.5 kWh/m² daily — among the highest of any major solar market in the world.
But the Northern Cape is also a mining region. The operational environment around active mining operations — copper, iron ore, manganese, diamonds — creates a soiling profile that is distinct from both the desert dust of MENA and the agricultural particulate of the Highveld. Mining operations generate fine metallic and mineral particulate that settles on panel surfaces differently from silica-based desert dust: it is denser, more adhesive, and in some cases slightly conductive — which creates a different set of considerations for soiling loss estimation and cleaning protocol design.
A feasibility study that uses a generic South African soiling assumption for an installation adjacent to an active mining operation in the Northern Cape is not modeling the actual operating environment. The soiling gap between assumption and reality on such a site is likely to be as significant as the gap documented on comparable industrial sites across MENA — with direct financial consequences per MWp that compound annually across the project lifetime.
The thermal profile — extreme diurnal cycling
South Africa does not experience the sustained extreme heat of Upper Egypt or Saudi Arabia’s interior. But the Northern Cape and the Highveld experience something equally demanding for solar equipment: extreme diurnal temperature variation — the difference between nighttime minimum and daytime maximum temperatures in a single 24-hour period.
In the Northern Cape in summer, this variation regularly exceeds 25°C to 35°C per day. For solar panels, this daily thermal cycling creates repeated mechanical stress on cell interconnects, frame adhesives, and encapsulant materials — a degradation pathway that operates at high frequency in South Africa even when peak temperatures do not reach the sustained extremes of the Sahara.
Field analysis from comparable high-diurnal-cycling environments shows that this thermal cycling profile accelerates micro-crack propagation at a rate that may be higher than in moderate-cycling temperate climates, even when peak temperatures are lower. The 25-year degradation model for a Northern Cape installation should reflect this cycling characteristic, not just the peak temperature profile.
The SAWEM implications — performance is now commercially measured
The launch of SAWEM in April 2026 changes the financial stakes of solar performance measurement for C&I operators who participate in the wholesale market. In a simple autoconsumption model, underperformance reduces savings. In a SAWEM-connected PPA structure, underperformance has direct contractual consequences — failure to deliver committed generation volumes triggers penalties, reduces PPA revenue, and affects the creditworthiness of the solar asset for future financing.
This is a new operational reality for South African C&I solar — and it makes the commissioning baseline, the O&M protocol, and the performance monitoring framework not just good practices but commercial necessities.
Here is how South Africa’s operating environment compares to other major African solar markets across the most financially consequential risk dimensions:
| Market | Primary Soiling Type | Diurnal Cycling | Peak Summer Temp | O&M Complexity | Estimated Annual Loss per MWp — Unmanaged |
|---|---|---|---|---|---|
| Morocco — heavy industrial | Cement + desert dust | Moderate — 15°C to 20°C | 40°C to 45°C | High | 18,000 to 28,000 USD |
| Egypt — Nile Delta | Urban + agricultural | Low to moderate | 38°C to 42°C | High | 18,000 to 30,000 USD |
| Egypt — Upper Egypt | Desert dust | Moderate | 45°C to 50°C | Very high | 22,000 to 35,000 USD |
| Saudi Arabia — interior | Fine desert sand | Low to moderate | 50°C+ | Very high | 25,000 to 40,000 USD |
| SA — Northern Cape mining | Mineral + metallic particulate | Very high — 25°C to 35°C | 38°C to 42°C | High | 15,000 to 25,000 USD |
| SA — Highveld industrial | Agricultural + industrial | High — 20°C to 30°C | 32°C to 38°C | Moderate to high | 12,000 to 20,000 USD |
| SA — Western Cape | Coastal + agricultural | Moderate | 28°C to 34°C | Moderate | 8,000 to 15,000 USD |
The Three Operational Gaps That Will Define South African C&I Performance
South Africa’s solar market has moved beyond crisis-mode installation. The challenge documented by SAPVIA for 2026 is execution quality — and execution quality in solar PV is determined by three operational decisions that most C&I installations in South Africa’s growth phase have not yet resolved.
Gap 1 — Soiling assumptions that do not reflect the actual site
South Africa’s diversity of operating environments — from the Northern Cape’s mining districts to the Highveld’s agricultural and industrial zones to the Western Cape’s coastal areas — means that a single national soiling assumption is meaningless for any specific installation.
Field measurements from comparable industrial environments confirm that the gap between a generic regional soiling assumption and the site-specific reality can reach 3% to 5% of annual production. For SAWEM-connected installations, this shortfall has direct contractual implications that amplify the financial consequence of an unvalidated soiling assumption into a multi-year revenue and penalty exposure.
The solution is straightforward and inexpensive relative to the investment it protects: a 30-day site-specific dust deposition measurement before finalizing the energy yield model. It is almost never specified in South African C&I solar procurement documentation.
Gap 2 — Commissioning gaps from the crisis-installation period
The installations commissioned between 2022 and 2024 — during the acute load shedding crisis — were commissioned under time pressure, with acute cost sensitivity, and in many cases without the extended testing protocols that a sophisticated market-led installation would include.
Aerial thermographic data across a cumulative global fleet of nearly 400 GW shows that the average power loss at commissioning is 4.46% — before any operational degradation has occurred. For South African installations commissioned during the crisis period, this figure is likely at or above the global average — because crisis-period commissioning prioritizes speed over rigor.
A practical retrospective commissioning audit for a South African C&I installation commissioned between 2022 and 2024 follows four steps:
First — full-array EL imaging inspection conducted during stable irradiance conditions to establish the current cell-level defect inventory — compared against any commissioning EL data if it exists, or used as a new baseline if it does not.
Second — thermal imaging scan under operating load to identify active hot spots and connection resistance anomalies that have developed since commissioning.
Third — IV curve tracing on a 5% to 10% statistical sample to quantify actual degradation against the original flash-test specification.
Fourth — a corrected PR calculation for the most recent 12 months of monitoring data — temperature and irradiance corrected — compared against the contractual commissioning PR baseline.
The total cost of this audit on a typical South African C&I installation is 8,000 to 20,000 USD. The value of knowing the true performance baseline of an asset that will operate for another 20 years is not a financial calculation.
Gap 3 — O&M protocols not calibrated to South Africa’s specific environment
Generic O&M protocols — cleaning schedules based on regional averages, inspection frequencies derived from moderate-climate benchmarks — do not adequately address the specific operational requirements of South African C&I installations.
For Northern Cape mining-adjacent sites: the metallic and mineral particulate from mining operations requires a cleaning assessment that goes beyond standard dust deposition rates. The adhesion characteristics of mining particulate mean that cleaning intervals calibrated to silica-based desert dust will underestimate actual cleaning requirements — and that some standard cleaning methods may be less effective than for conventional soiling types.
For Highveld industrial sites: the combination of agricultural particulate, industrial emissions, and high diurnal thermal cycling requires quarterly physical inspection — string current measurement and thermal imaging — rather than the annual inspection cycle that some O&M contracts specify.
For SAWEM-connected installations specifically: monthly PR calculation with full temperature and irradiance correction — against a commissioning baseline established using rigorous methodology — is not optional. It is the measurement framework that makes SAWEM performance obligations manageable.
South African C&I Solar — Decision Framework
The following diagram guides South African C&I operators through the priority actions based on their installation’s commissioning period and market connection profile:
flowchart TD
    A[South African C&I\nSolar Installation] --> B{When was it\ncommissioned?}
    B -->|2022 to 2024\nCrisis period| C[Retrospective\nCommissioning Audit\nRequired]
    B -->|2025 to 2026\nMarket-led growth| D{EL imaging\nconducted at\ncommissioning?}
    C --> E[EL Imaging\nFull array]
    C --> F[Thermal Imaging\nUnder load]
    C --> G[IV Curve Tracing\n5% to 10% sample]
    C --> H[Corrected PR\nBaseline calculation]
    E --> I[True Performance\nBaseline Established]
    F --> I
    G --> I
    H --> I
    D -->|Yes — baseline exists| J{Site-specific\nsoiling measurement\nconducted?}
    D -->|No — standard\ncommissioning only| C
    J -->|Yes — validated| K{SAWEM\nconnected?}
    J -->|No — regional\naverage used| L[30-day Soiling\nMeasurement\nRequired]
    L --> K
    K -->|Yes| M[Monthly PR\nwith full correction\nmandatory]
    K -->|No — autoconsumption| N[Quarterly Physical\nInspection\nrecommended]
    I --> J
    M --> O[O&M Protocol\nCalibrated to\nSAWEM Requirements]
    N --> P[O&M Protocol\nCalibrated to\nSite Environment]
    O --> Q[Performance\nManaged — Financial\nReturns Protected]
    P --> Q
    style C fill:#ff6b6b,color:#fff
    style L fill:#ffd93d,color:#000
    style I fill:#51cf66,color:#fff
    style O fill:#51cf66,color:#fff
    style P fill:#51cf66,color:#fff
    style Q fill:#2f9e44,color:#fff
Legend: 🔴 Red = immediate action required | 🟡 Yellow = validation needed | 🟢 Light green = baseline established | 🟢 Dark green = performance protected
What South African C&I Operators Should Do Differently From Day One
Three actions that translate the operational lessons of Africa’s most mature solar market into practical decisions for the next generation of C&I installations:
Action 1 — Specify site-specific soiling measurement in the project development scope
Before any feasibility study is finalized for a C&I solar installation in South Africa — particularly in the Northern Cape or adjacent to industrial or mining operations — a 30-day dust deposition study at the actual installation location should be a standard project development activity. The cost is negligible relative to the investment it informs. The gap between a generic assumption and a measured site-specific value can represent a significant annual revenue difference on a SAWEM-connected installation where generation shortfalls have contractual consequences.
Action 2 — Commission a performance audit on crisis-period installations
For any C&I solar installation commissioned between 2022 and 2024, a retrospective commissioning audit — EL imaging, thermal imaging under load, IV curve tracing, corrected PR baseline — provides the performance baseline that was never properly established at handover. This is not a criticism of the original EPC contractor. It is a business decision: knowing the true performance baseline of an asset is the prerequisite for managing it effectively over its remaining operational lifetime.
Action 3 — Align the O&M protocol with the SAWEM commercial reality
For SAWEM-connected C&I installations, the O&M protocol is no longer just a maintenance document. It is a commercial risk management framework. Monthly PR measurement with full correction methodology, quarterly physical inspection including string current measurement, and annual thermal imaging are the minimum activities that allow a SAWEM participant to manage the gap between committed and actual generation.
For engineers, technical directors, and O&M managers building the analytical framework needed to manage South African C&I solar assets with the rigor that SAWEM participation requires — Solar Energy Engineering: Processes and Systems by Soteris Kalogirou provides one of the most comprehensive technical treatments available of system-level performance analysis, degradation modeling, and O&M framework design in high-irradiance environments.
South Africa has built something that no other African market has achieved: a solar PV installed base that is large enough, mature enough, and commercially integrated enough to demand genuine operational sophistication from the C&I operators who own it.
The crisis-mode installations of 2022 to 2024 solved an urgent problem — they kept factories running, reduced diesel consumption, and stabilized operating costs during a period of acute grid stress. That was the right priority at the time.
The market-led growth phase of 2026 and beyond requires something different: installations that are commissioned rigorously, operated to a standard calibrated to their specific environment, and measured against a performance baseline that makes the gap between projected and actual output quantifiable and manageable.
The soiling in a Northern Cape mining operation is not the soiling of a Moroccan cement plant. The diurnal thermal cycling of the Highveld is not the sustained peak heat of Upper Egypt. The SAWEM commercial framework creates performance obligations that do not exist in a simple autoconsumption model.
On a typical C&I industrial installation in South Africa’s Northern Cape — combining a site-specific soiling gap above generic assumptions, diurnal thermal cycling that accelerates micro-crack propagation beyond standard degradation models, and commissioning defects that were never detected during the crisis-installation period — the total preventable performance gap over a 25-year project lifetime reaches 180,000 to 350,000 USD per MWp. Not from equipment failure. Not from grid constraints. From operational decisions that were made — or not made — in the first weeks of the installation’s life.
South Africa’s C&I solar market has done the hard work of building the installed base. The work that remains — and that will determine whether that installed base delivers its promised financial return over the next 20 to 25 years — is operational. It happens site by site, installation by installation, in the commissioning audit, the monthly PR calculation, the quarterly string inspection, and the annual thermal imaging program.
That work is not glamorous. It does not generate press releases or ribbon-cutting ceremonies.
It generates performance — sustained, measured, and financially defensible — for the full project lifetime.
The operational comparisons, soiling analysis, and O&M frameworks referenced in this article are informed by field measurement and analysis on industrial solar installations in MENA and by the operational dataset documented in the MENA Industrial Solar Data Guide.
The monthly inspection protocol, commissioning baseline methodology, and soiling measurement framework documented in the guide translate directly to the South African C&I context — because the operational gaps are the same regardless of geography. The specific soiling type differs between a Moroccan cement plant and a Northern Cape mining operation. The financial consequence of not measuring it site-specifically does not.
For South African C&I operators building or reviewing their O&M frameworks in the context of SAWEM participation — the guide provides the measured performance trajectory and monthly inspection protocol that makes SAWEM performance obligations manageable rather than theoretical.
Get the Free Preview
The first 8 pages of the MENA Industrial Solar Data Guide — real Performance Ratio data, soiling measurements, and thermal derating figures from an industrial installation— No spam, just real data.
Disclosure: This article contains affiliate links. If you purchase through these links, I may earn a small commission at no extra cost to you. I only recommend technical resources that I consider genuinely useful for industrial solar professionals working in Africa and the MENA region.
Publié par :
Solar PV MENA Expert