
Published on: July 01, 2026.
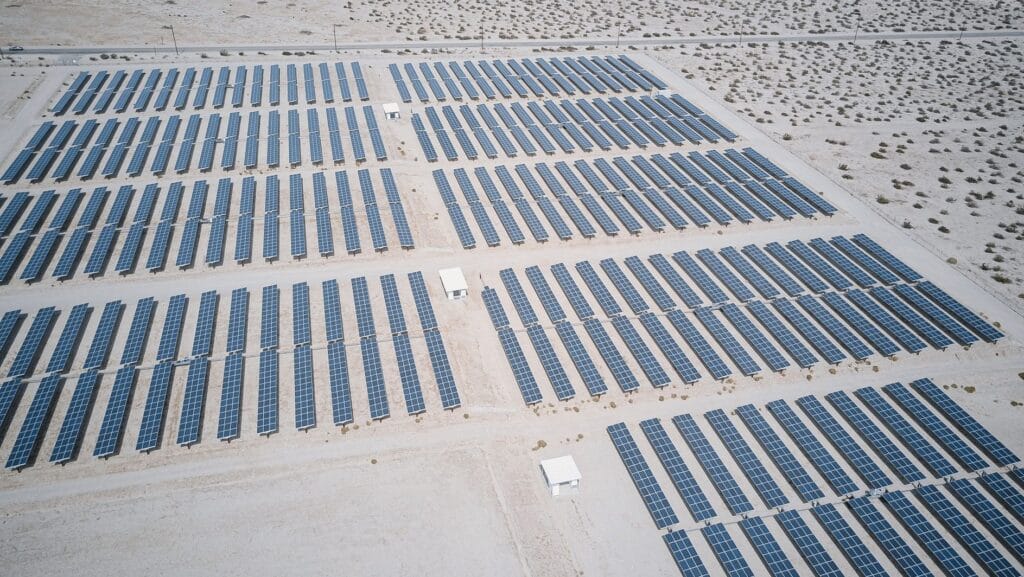
When analyzing the Saudi Arabia solar landscape, there is a specific kind of optimism that surrounds large-scale project announcements.
Numbers are published. Targets are set. International consortia sign agreements. Press releases describe gigawatts, investment pipelines, and transformation timelines. The ambition is genuine. The financing is real. The political will exists.
And then the installation goes live — and the desert starts asking questions that no feasibility study fully prepared anyone to answer.
Saudi Arabia is building something genuinely significant. More than 70 GW of solar capacity targeted by 2030. A market estimated to reach 145 billion USD by 2034. The Al Shuaibah project is setting world records for the lowest cost of solar electricity ever achieved. Gigawatt-scale installations like the 1.5 GW Sudair Solar Plant are already operational. A 32 billion USD investment pipeline in active development.
The ambition is real. So is the desert.
And the desert — whether in Morocco’s southern provinces or Saudi Arabia’s vast interior — does not forgive the same operational mistakes twice. It just compounds them, quietly, year after year, in performance data that looks acceptable until someone measures it carefully enough to see what is actually happening.
This article is about what those measurements show — and what Saudi Arabia’s solar sector can learn from operational experience already accumulated in North Africa, before the same gaps appear at a scale that makes them significantly more expensive to ignore.
Disclosure: This article contains affiliate links. If you purchase through these links, I may earn a small commission at no extra cost to you. I only recommend technical resources that I consider genuinely useful for industrial solar professionals working in Africa and the MENA region.
What Saudi Arabia Solar Projects Are Actually Building
The scale of Saudi Arabia’s solar ambition is worth understanding precisely, because it frames everything that follows.
The Kingdom targets installing over 70 GW of solar capacity by 2030, representing nearly six times current output. The Vision 2030 renewable energy strategy includes a target of 58.7 GW of renewable energy capacity, of which 40 GW will be solar PV, with the goal of generating 50% of the Kingdom’s electricity from renewable sources by 2030.
The Saudi Power Procurement Company manages competitive auction mechanisms that have produced some of the world’s lowest solar electricity prices. The Al Shuaibah project in particular set a benchmark for cost-competitive utility-scale solar that influenced project development across multiple continents.
Multiple gigawatt-scale projects are advancing through development phases, including the 1,000 MW Al Masa’a IPP Solar Power Plant in the Hail province, and the Tabarjal 400 MW Solar PV project awarded to Jinko Power Technology, with construction starting in 2025 and commercial operation expected by 2026.
Saudi Arabia is also scaling up battery storage ambitions, targeting 48 GWh of battery energy storage capacity by 2030, driven by Vision 2030.
This is not a pipeline of announced intentions. It is a construction program already in execution — with real equipment, real deadlines, and real financial commitments from investors who will expect real returns.
Those returns depend entirely on one thing: how well these installations actually perform once operational, in the real environment of the Arabian Peninsula, not in the models that justified the investment. This data is crucial for the future of saudi arabia solar installations.
What the Arabian Peninsula Environment Actually Does to Solar Equipment
This is the conversation that feasibility studies and investment decks rarely have in sufficient depth — and it is the most important one for anyone whose money or career depends on an installation performing as promised.
Saudi Arabia’s solar irradiance levels are among the highest in the world. This is a genuine advantage and it is correctly cited as one of the primary drivers of the Kingdom’s competitive position in solar energy. What is less frequently discussed with equal rigor is what comes with that irradiance in a desert industrial environment: dust, heat, and operating conditions that stress equipment in ways that standard European or North American performance models do not adequately capture.
Morocco and Saudi Arabia share more operational DNA than their geographic distance suggests. Both operate in high-irradiance, high-dust environments. Both are building industrial solar at scale, largely on sites where heavy activity generates particulate contamination that standard soiling models underestimate, and both are discovering — at different stages of the learning curve — that the gap between feasibility projections and operational reality is not random. It is predictable, measurable, and largely preventable.
Here is what that gap actually looks like, compared directly between the two environments:
| Operational Factor | Morocco — Real Field Data | Saudi Arabia — Conservative Estimate |
|---|---|---|
| Annual soiling loss — industrial site | 5% to 8% | 6% to 10% — more arid environment |
| Inverter room temperature — summer | 50°C to 55°C | 55°C to 65°C — more extreme conditions |
| Thermal derating observed | 6% to 12% | 8% to 15% — proportionally more severe |
| Performance Ratio observed | 77% to 84% | To be validated — likely comparable or lower |
| Required cleaning frequency | 3x per month minimum | To be determined — likely higher |
This table is not a theoretical comparison. The Morocco column is measured data from a real operating installation. The Saudi Arabia column is a conservative, evidence-based projection from a more demanding version of the same operating environment. The gap between the two columns is not random variation — it reflects the physics of a hotter, drier, more dust-intensive climate.
Soiling in desert industrial environments — the systematic underestimation
Standard feasibility studies for solar projects in the MENA region typically model soiling losses at 3% to 5% annually. This figure comes from generalized regional data and is applied broadly across project types, regardless of the specific site’s industrial activity, proximity to construction or logistics operations, or local sand transport patterns.
On heavy industrial sites — cement plants, petrochemical facilities, industrial zones — the actual sustained soiling loss runs between 5% and 8% annually, based on measured data from operating installations. The difference between a 3% assumption and a 7% reality does not appear in a single reporting period. It compounds across the project lifetime, quietly widening the gap between projected and actual returns.
In the Arabian Peninsula’s desert environment, with its dust storms, fine particulate transport, and high ambient temperatures that accelerate dust adhesion to panel surfaces, there is no credible basis for assuming that soiling behavior will be more benign than what has been documented on comparable sites in North Africa. In some scenarios — particularly during shamal wind events or in proximity to industrial activity — it will be more severe.
Thermal derating — the invisible summer loss
Inverter room ambient temperatures in Morocco’s industrial installations regularly reach 50°C to 55°C during peak summer months. This triggers thermal derating — an automatic reduction in inverter output to protect internal components — of 6% to 12%, occurring without generating a single alarm on the monitoring system.
Saudi Arabia’s summer temperatures are not milder than Morocco’s. In many locations across the Kingdom, they are more severe. An inverter room in Riyadh or the Eastern Province in July faces thermal conditions that are at least as challenging as anything documented on a Moroccan industrial site — and potentially more so.
The financial consequence is direct and calculable. On a system generating 360,000 USD per year in energy savings, an 8% summer derating loss applied across four peak months represents approximately 9,600 USD per year in avoidable losses. Scale this to the 1.5 GW Sudair Solar Plant — operating at a sustained PR gap of 7% below projections due to soiling and thermal derating alone — and the annual production shortfall would represent tens of millions of dollars in lost revenue, compounding across a 25-year PPA lifetime into a figure that dwarfs any O&M investment required to prevent it.
Monitoring gaps — what the dashboard does not show
String losses exceeding 15% have been identified on industrial solar installations in Morocco through physical inspection — losses that generated no alerts on the monitoring system and were invisible in the production data until a systematic on-site measurement program identified them.
There is no reason to expect that monitoring systems on Saudi Arabian installations will automatically detect what monitoring systems in Morocco consistently miss. The technology is the same. The fundamental limitation — that monitoring records production but does not diagnose its causes — is the same.
The most expensive performance losses on industrial solar installations are the ones that look like nothing on the dashboard. This is true in Morocco. It will be true in Saudi Arabia.
What the Feasibility Studies Are Probably Getting Wrong
Saudi Arabia’s renewable energy ambitions require overcoming technical challenges including global supply chain issues, localization requirements, and an adequate supply of engineers and technicians to meet growing demand in the sector.
The human capital challenge is real and well-documented. Less discussed is the modeling challenge — the systematic gaps in how feasibility studies for large-scale solar projects in desert environments account for real operational losses.
Based on documented experience with feasibility studies in the MENA region — including an independent review of a project exceeding 5 million USD in Morocco — three gaps appear consistently:
Gap 1 — Soiling modeled at generic regional averages rather than site-specific measurements
A soiling assumption of 3% to 5% applied to a desert industrial site in Saudi Arabia is not a conservative estimate. It is an optimistic one, calibrated to average conditions across a diverse region rather than to the specific operating environment of a heavy industrial facility in an arid zone. The difference in financial terms, compounded over a 25-year project lifetime, is material.
Gap 2 — Inverter thermal derating absent from energy yield models
The irradiance data in Saudi Arabian feasibility studies is generally strong — the Kingdom has invested in comprehensive solar resource measurement, with over 1,200 measurement stations across 850,000 square kilometers. But even accurate irradiance data does not capture what happens inside an inverter room at 55°C during a peak summer afternoon. This loss is real, measurable, and systematically absent from standard yield models.
Gap 3 — P50 projections without meaningful P90 sensitivity analysis
A P50 yield projection means there is a 50% probability of achieving that output in any given year. For a utility-scale project with a 25-year power purchase agreement and project financing from institutional lenders, a P50-only base case without a robust P90 sensitivity analysis is not conservative financial modeling — it is optimism with an engineering stamp on it.
For engineers and developers working on large-scale solar projects in Saudi Arabia and the wider MENA region who want to build a genuinely rigorous understanding of how to identify, model, and close these gaps between projected and actual performance, Solar Energy Engineering: Processes and Systems by Soteris Kalogirou provides one of the most analytically complete treatments available. It covers degradation mechanisms, soiling behavior, system-level performance modeling, and O&M frameworks with the depth needed to interrogate a feasibility study’s assumptions rather than simply accept them — directly applicable to the scale of projects now being commissioned across the Kingdom.
What Saudi Arabia’s Solar Sector Can Learn From Morocco’s Experience
The lessons are not complex. They are consistent, documented, and available — if the people making decisions about project design and O&M planning are looking for them.
Lesson 1 — Size your O&M cleaning budget against your actual environment, not a generic benchmark
Three cleaning cycles per month was the operational reality on an industrial solar installation in Morocco — not a conservative assumption, but the minimum required to keep soiling from becoming a significant performance drag.
A cleaning program calibrated to the actual soiling recovery curve of a desert industrial site — rather than to a generic quarterly schedule — typically costs between 15,000 and 40,000 USD per year per MWp in additional labor and water resources, depending on site conditions and access. Against a soiling loss of 5% to 8% on a system generating 180,000 USD per MWp per year in energy value, this investment recovers 3 to 5 times its cost annually — making it one of the highest-ROI operational decisions available to a project owner.
For installations in the Arabian Peninsula’s dust environment, this baseline deserves explicit validation against site-specific soiling data before project financial models are finalized.
Lesson 2 — Design the inverter room for the climate, not for a generic datasheet
The most cost-effective intervention for thermal derating — mechanical ventilation of the inverter room — costs between 800 and 2,500 USD installed and can recover losses well above that cost within the first operational year. At the design stage, it costs almost nothing to specify. In an operating installation with a thermally compromised inverter room, retrofitting becomes expensive and logistically complicated.
Lesson 3 — Build a supervision approach, not just a monitoring system
Monitoring records what the meter measures. Supervision understands why the meter shows what it shows. The most consequential performance losses on industrial solar installations — string degradation, soiling beyond model assumptions, thermal derating events — are systematically invisible to monitoring systems and visible only through physical inspection and systematic measurement.
A dashboard that shows green does not mean the plant is performing. It means the plant is alive. These are not the same thing.
Lesson 4 — Model your P90 scenario with honest assumptions
The gap between a P50 projection and a P90-calibrated financial model — adjusted for realistic soiling, thermal derating, and irradiation uncertainty — is not a rounding error in a large-scale project. It is the difference between a project that delivers its promised return and one that generates investor conversations that should have been feasibility-stage conversations.
Saudi Arabia’s solar ambition is real, it is well-financed, and it is already in execution. The Kingdom has genuine structural advantages — exceptional irradiance, vast available land, competitive procurement mechanisms, and a government commitment demonstrated by billions of dollars of signed contracts.
None of that is in question here.
What is in question is whether the people responsible for making these installations perform at the level the financial models promise are asking the right operational questions before construction begins — and building the O&M discipline required to close the gap between projected and actual performance once operations start.
This operational gap matters beyond industrial autoconsumption alone. Saudi Arabia’s NEOM Green Hydrogen project — powered by 4 GW of dedicated solar and wind capacity — depends on solar PV performing at or above projected levels to deliver competitive levelized cost of hydrogen. The same soiling, thermal, and monitoring gaps documented in this article apply directly to that infrastructure. The stakes are proportionally higher — and the margin for operational complacency proportionally smaller.
The desert does not negotiate. It does not adjust its dust levels to match a soiling assumption someone chose in an office. It does not moderate its summer temperatures to keep inverters within rated operating range. It does not generate alarms when a string slowly degrades below 15% of expected output.
Morocco’s experience with industrial solar in a demanding desert-adjacent environment demonstrates clearly what happens when these realities are underestimated: not catastrophic failure, but systematic, compounding underperformance that erodes returns quietly and predictably over years.
Saudi Arabia has the scale, the resources, and the strategic vision to build something genuinely significant in solar energy. The question is whether the operational discipline will match the ambition — starting now, at the feasibility and design stage, before the desert starts answering questions that should have been asked earlier.
Looking for verified data?
The field insights behind this article are fully documented in the MENA Industrial Solar Data Guide. Get access to real project costs, actual KPIs, and genuine O&M benchmarks from a live industrial installation in the MENA region.
👉📘 75 pages of pure field data. Zero simulations.
👉 Get the Guide — $29 USD
Get the Free Preview
The first 8 pages of the MENA Industrial Solar Data Guide — real Performance Ratio data, soiling measurements, and thermal derating figures from an industrial installation— No spam, just real data.
Disclosure: This article contains affiliate links. If you purchase through these links, I may earn a small commission at no extra cost to you. I only recommend technical resources that I consider genuinely useful for industrial solar professionals working in Africa and the MENA region.
Publié par :
Solar PV MENA Expert